Nowadays, running backs appear to be interchangeable. Recently it feels like whenever a star running back goes down, the fill-in RB performs just as well as the starter. This has been a common occurrence this season: Charcandrick West / Spencer Ware for Jamaal Charles, Jeremy Langford for Matt Forte, Thomas Rawls for Marshawn Lynch just to name a few.
Witnessing all these 2nd string running backs run wild inspired me to look into the relationship between RB usage and their salaries during the 2014 season.
To measure "RB usage", there are 2 stats I will primarily be using:
- Offensive Usage: Rushing Attempts + Receiving Targets per Game
- Offensive Snaps per Game
I used their salary cap value to measure salary and filtered out players who played 0 games or had less than 10 attempts/targets from the data.
First off, I was interested comparing salary and usage based on team rank i.e. How often does the highest paid RB on a team also have the highest RB usage rate? What about the second highest paid RB on a team? etc...
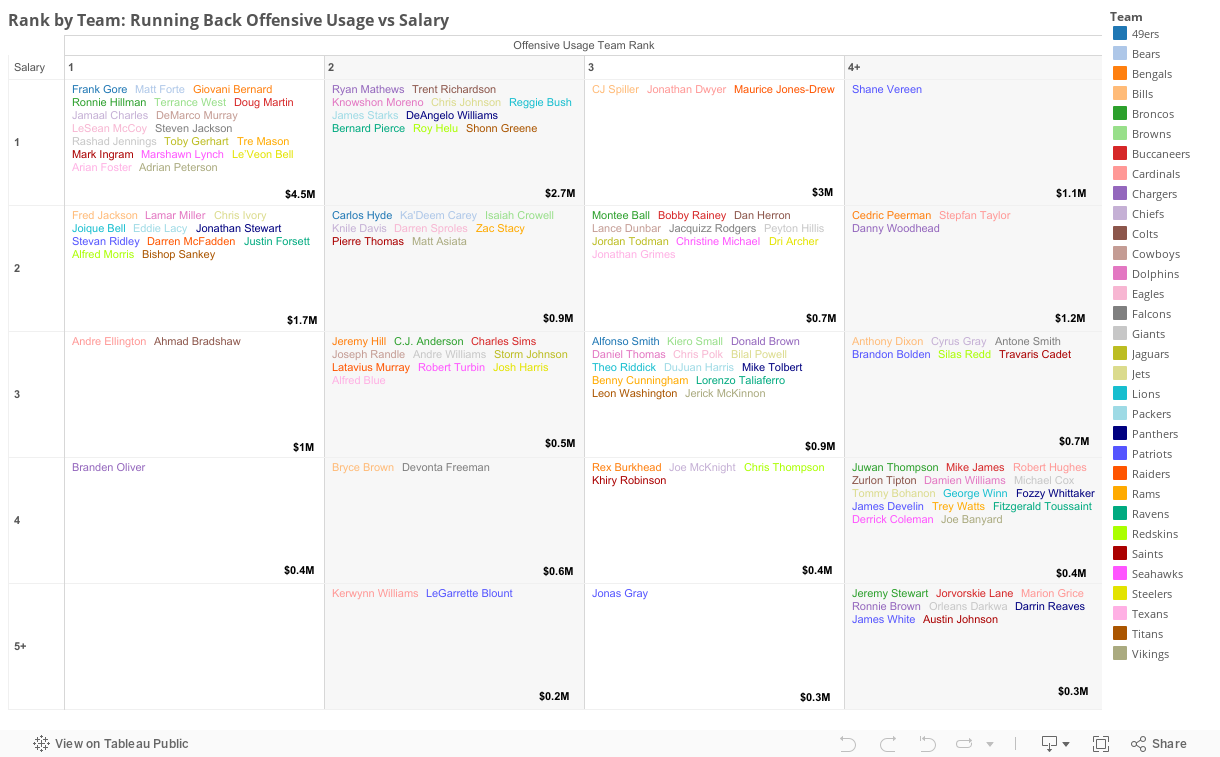
Click and drag for player count. Annotations represent avg salary. Avg salary for all RBs is $1.5M
For 18 out of the 32 teams (56%), the highest paid RB also has the most RB attempts/targets per game.
Looking at the chart, you can quickly identify top over-performers and the under-performers based on salary cap value:
Top Overachievers: Brandon Oliver ($420,000), Andre Ellington ($521,000)
Top Underachievers: CJ Spiller ($5.9M), Maurice Jones-Drew ($2.5M)
Below is a graph which compares Offensive Usage to Salary:
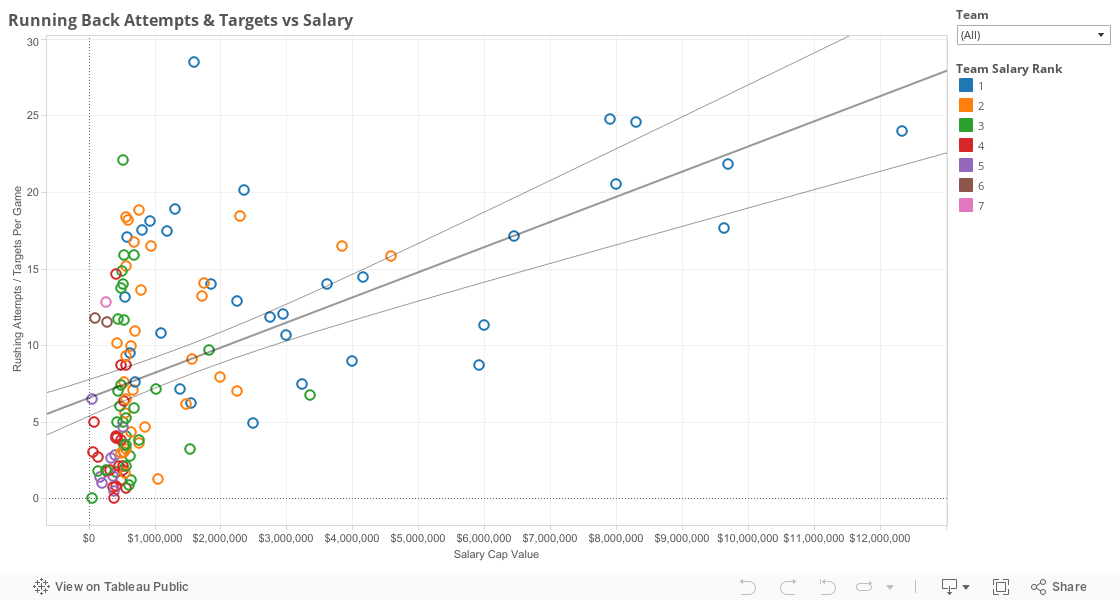
DeMarco Murray was due for a pay raise! He averaged 28.5 attempts/targets per game, yet was paid only $1.6M. Despite his enormous workload, his salary cap value is equal to Bilal Powell's, who only averaged 3.2 attempts/targets per game.
This graph looks at Offensive Snaps per Game vs Salary:
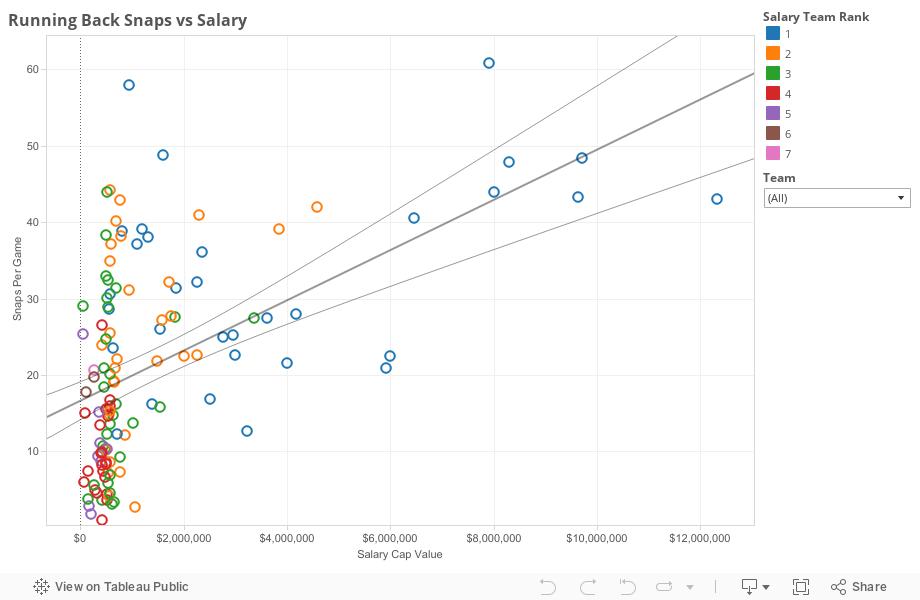
Matt Forte was the epitome of a workhorse RB. He averaged 61 snaps per game, which is 12 more than DeMarco Murray's 49.
In the graph above I also added "Adjusted Snap %" to put it all in perspective (hover mouse over players for additional stats).
Adjusted Snap % = Avg. Offensive Snaps per game / Avg. Team Offensive Snaps per game
Matt Forte's Adjusted Snap Percentage was 92%; he was on the field for approximately 92% of all offensive plays for the Bears in games he played. For comparison, Jamaal Charles, who had the 5th highest Adjusted Snap % in 2014, was at 69%.
Data Sources:
www.sportingcharts.com
www.footballoutsiders.com
www.overthecap.com
www.footballdb.com