The NHL is one of the latest leagues to openly embrace advanced statistics. Earlier this year, NHL.com introduced their new "Enhanced Stats" feature to give hockey fans additional ways to analyze players' and teams' performances.
There are now so many metrics available in hockey to evaluate how good a team really is. But which of these stats is the best indicator of how many wins a team will have in a season?
I will look at the following metrics:
Goals For Percentage (GF%): GF / (GF + GA)
Shots on Goal For Percentage (SF%): SF / (SF + SA)
Corsi For Percentage (CF%): CF / (CF + CA)
Corsi For = Shots on Goal + Missed Shots
Fenwick For Percentage (FF%): FF / (FF + FA)
Fenwick For = Shots on Goal + Missed Shots + Blocked Shot Attempts
Zone Start Percentage (ZS%): OZFO% / (OZFO% + DZFO%)
OZFO% = Percentage of faceoffs that take place in the offensive zone
PDO: Sh% + Sv%
I will run regression analyses to determine which of these metrics best correlates with team wins.
Stats and team records from the 2014-2015 regular season will be used. All the stats will be for all situations, instead of 5v5 only. I will also disregard shootout wins and only use Regulation and Overtime Wins (ROW) in my analysis.
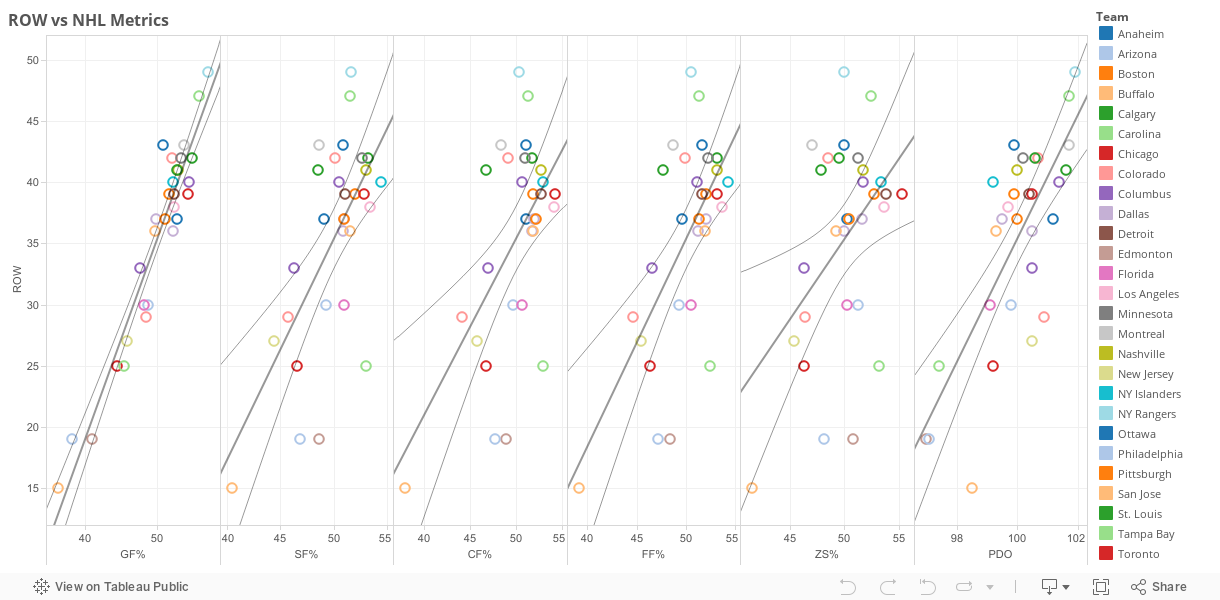
Note: For all the stats above, NHL average is 50% except for PDO, which is 100.
R-Squared:
GF%- 0.92
SF%- 0.43
CF%- 0.33
FF%- 0.42
ZS%- 0.21
PDO- 0.58
Quick Observations:
-It's no surprise GF% has the highest correlation with season wins
-Interestingly, the more basic statistic SF% has a higher correlation with wins than CF% and FF%.
-PDO, which is often used to measure "puck luck", is a better predictor of wins than "puck possession stats" such as CF% and FF%.
Data Source: www.puckalytics.com