Can we anticipate how well a NFL team will perform based on how they allocate their salary cap money?
This is the question I'll attempt to answer using 2014 team stats and cap figures. All salary cap figures are from the start of the 2014 season and don't take into account mid-season transactions.
First off, I'll take a look at whether there is an optimal way of allocating salary cap money between positions.
Below are 2 charts that break down positional spending by team. The teams are sorted by total number of wins in the first chart.
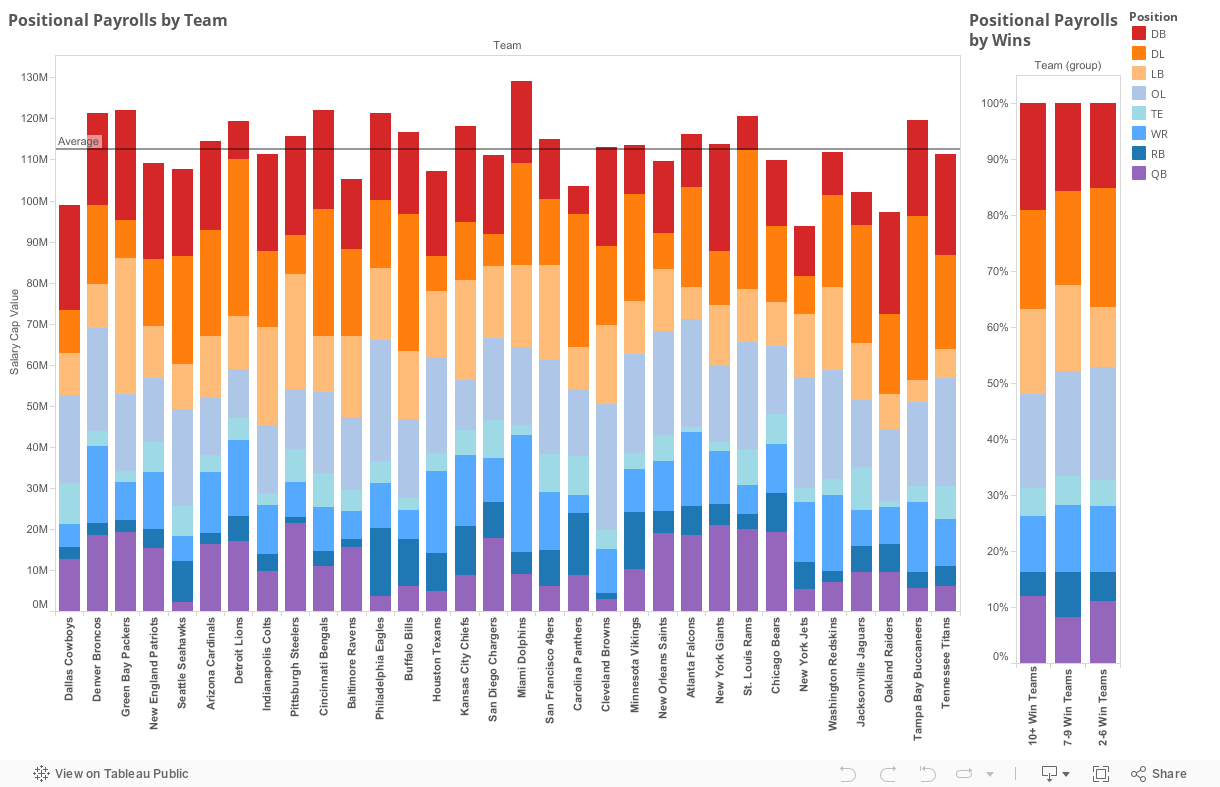
Filter by clicking on a position on the far right, and selecting "Keep Only" or "Exclude". Click on team name to view sum of salary cap value.
Quick Observations:
- Although the Cowboys had the third lowest overall spending (behind the Jets and Raiders), they finished the 2014 season tied with league best 12 wins.
- The Seahawks also finished with 12 wins despite spending only about $18M on offensive skill positions (QB, RB, WR). Only the Browns spent less on those positions.
- The Dolphins had the largest total payroll at $129M, significantly more than the $113M league average, but finished with only 8 wins.
Overall, it doesn't seem like there is much of a relationship between a team's total spending/salary cap allocation and number of wins, other than a couple small differences:
1. 10+ win teams tend to spend more on DBs ($22M vs $17M)
2. Teams with 6 wins or less tend to spend less on LBs ($12M vs $17M)
That being said, there isn't an optimal way to divvy up salary cap money and many different approaches can be taken to build a successful team.
Below is a dashboard I created. The relationship between positional spending and various team stats can be analyzed by selecting different criteria.
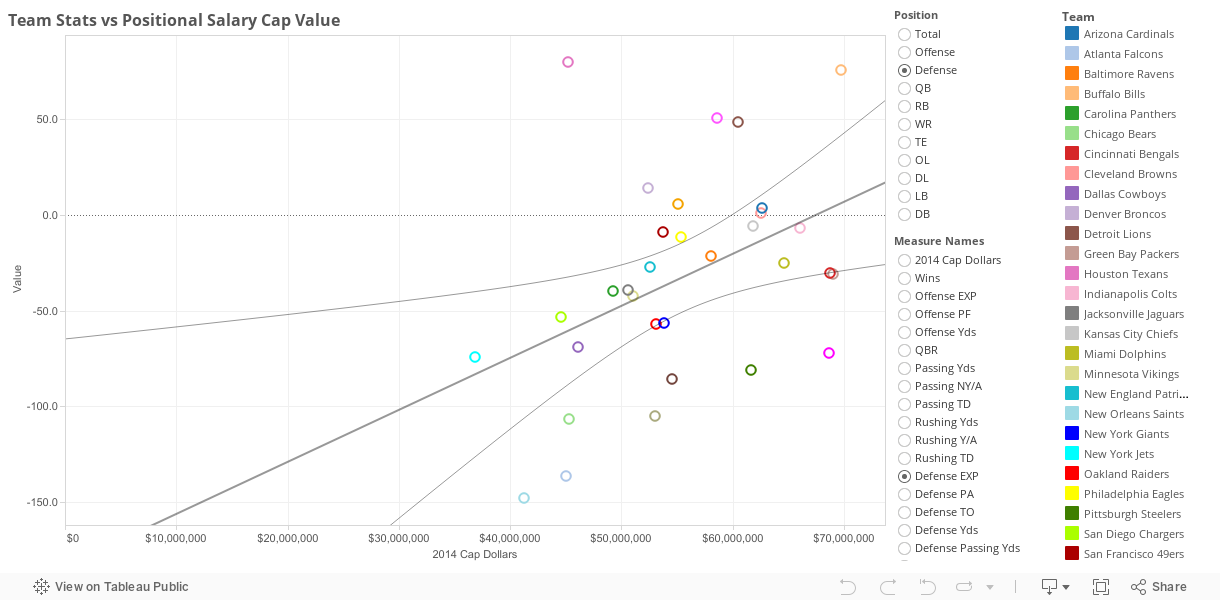
EXP stands for Expected Points. It's an advanced metric that indicates how well an Offence or Defense performs. Here's a great article which explains how it is calculated.
Quick Observations:
-Although there is some sort of correlation between defensive spending and Defense EXP (0.19 r-squared), there is none at all between offensive spending and Offence EXP (0.02 r-squared)
-There seems to be little to no correlation between positional spending and most of these stats. This dashboard should be used as more of a tool to determine which teams have over-performed or under-performed based on salary cap spending. For example, assessing the relationship between QB spending and Passing Yards (r-squared 0.36), it can be determined that the Eagles and the Colts over-performed in that department, whereas the Rams could have expected more passing yards based on their QB spending.
Data Sources:
www.overthecap.com
www.pro-football-reference.com